The what, how, and why of enhancing social media performance with in-depth analysis.
Test. Measure. Analyze. Revise. Repeat.
Any good marketer knows that this is the magic formula for optimizing social media marketing performance.
We’re all pretty good at running reports on social media accounts with various engagement and post metrics, and clap with glee when we see those bar graph lines trending upwards.
We may also take pride in beautifully-crafted pie charts or reports that validate our investment in social media activities.
And, yes, we all measure vanity metrics such as “likes”, and are able to point out the best performing posts and the days and times that are best for engagement.
From this, you may argue that we have social media marketing ‘measuring’ down pat.
We then use these reports to create our next round of social media posts, so we’re ‘analyzing’, ‘revising’, and ‘testing’ as well…right?
Maybe not.
Honestly, how much are we really (*points at self here) analyzing the data we have access to, and using this analysis to optimize social media performance?
How do we know we are measuring the right things?
The harsh reality is that measuring social media performance is challenging, and greatly depends on how and what you are measuring. Now, I know the idea of in-depth social media analysis and measuring ROI can be daunting. After all we’re marketers not statisticians.
The great news is that with our easy-to-follow tips, you can take your analysis, and potentially your social media performance to the next level.
Social Media Performance Begins with SMART Goals
Think of social media marketing like running a marathon. Whether it’s finishing in first or second place or simply crossing the finish line, every runner trains for a marathon with a specific goal in mind. And every goal is measured, such as with a stop watch, mile markers or checkpoints. Without clearly defined goals or a way to measure your goals, running a marathon is more like a stampede of zebras, giraffes, and wildebeests, all wearing neon-colored shoes.
The same is true for social media marketing. Without measurable, attainable goals or quality metrics to measure performance, reaching your social media goals, whether it is to increase brand awareness or improve ROI is more like launching a rocket ship into outer space without any clue as to where it’s going.
One of the biggest setbacks in measuring social media ROI is if you’re analyzing the wrong data for your brand goals, or essentially running in the wrong direction! A solid social media strategy that involves proving positive social media ROI relies on defining measurable goals and objectives, such as do you want to increase brand awareness, create sales, or inspire customer loyalty and retention?
You need to define one or two measurable or SMART (specific, measurable, attainable, relevant and timely) goals or objectives. Defining your goals will in turn help you to determine what metrics you need to measure and analyze.
How to Measure Social Media ROI
Let’s break it down a step further. Before you can identify the necessary data, you need to know how you intend to measure your social media marketing ROI. Measuring social ROI should involve the following:
- Measuring engagement
- Understanding and measuring Click-through Rates (CTRs) and Impressions
- Tracking influence
- Measuring sentiment
- Centralizing social media analytics in one platform or dashboard.
Which Social Media Metrics Should You Measure?
As mentioned earlier, social media post “likes”, shares, and comments are easily captured in reports. The most popular social media sites, and MavSocial, have built-in insights and analytic functionality that capture the following information:
- Follower of fan growth
- Optimal times for engagement
- Audience demographics
- “Likes” and reactions to your posts and content
You also need data that measures your ROI, which may mean following metrics that indicate the number of leads, sales, clicks, conversion rates or other relevant actions. Our article on social media metrics you need to know highlights several suggestions for data analysis in addition to social media engagement.
Website Traffic and Actions
If you aren’t using social media to drive traffic to your website already, start doing it now.
Start by measuring the number of clicks through to a site or landing page. Then, drill down into more detailed analysis with tools such as Google Analytics and tracking pixels (like those used for Facebook for business campaigns and other advertising platforms). These can give you insights on:
- Traffic coming from individual social media channels
- Bounce rates of social media followers that leave your website shortly after visiting it
- Pages visited and whether followers and visitors took a specific action, such as visiting a landing page and proceeding to a checkout or registration page or not. With pixels you can even identify and retarget users who abandoned an action on your site.
The above information can be critical in quantifying leads and conversions generated from social media activities.
Social Media Mentions
Take the time to look at real insights into what people think about your brand, where they come from, and what they are saying about you across all social media – not just on your accounts.
You can also keep track of social mentions, direct messages, “likes”, retweets and other notifications right in the MavSocial app with Social Inbox. MavSocial makes it easy to monitor all social media conversations.
Measuring Influence
Kissmetrics recommends further analyzing influence and your brand’s share of mentions. It’s great to have social media mentions, but it’s even better if those mentions come from a key influencer. However, influence doesn’t always correlate with audience size or reach; it more often comes down to behaviors of the influencer’s friends or followers. The actions of an influencer’s audience are good indications of future actions.
Share of Voice
Building on the above, you should use the same metrics to compare your social media performance against your competitors. By measuring competitor engagement, reach, influence, mentions and sentiment over time, you can determine your brand’s share of voice metric. You should be able to identify what percentage of the overall conversation about your industry is focused on your brand compared to competitors.
Identify their successes and failures as well as your own, and learn from them.
How to Simplify Your Social Media Marketing Analysis
Social media performance measurement and analysis can be overwhelming. Although you likely have a better understanding of where to focus your social media analysis efforts and which methods can help you get there, a single, centralized platform can do most of the heavy lifting for you—plus streamline the process. This is exactly where MavSocial comes in.
For example, MavSocial can help with reporting. Some of the reports you can access with MavSocial include engagement by the time of day, day of the week, and by each platform linked to your MavSocial account.
By analyzing the data from these reports, you can determine why particular types of posts, days, or times work better than others. Although this is a great starting point, you may need to take a more detailed look at the data. If you dive deeper into your metrics and test assumptions, you may make unexpected discoveries.
A Great Deal of Social Media Success is Based on Trial and Error
For example, one of our clients always posted on Facebook at the same time each day because the metrics showed this was when most of their followers were active. However, their reach, engagement, and followers remained stagnant.
After analyzing the data we made an assumption that we may only be reaching the same group of followers each time. We weren’t reaching other followers that accessed Facebook at different times of the day. We tested the assumption by posting at different times throughout the day and immediately saw increased reach and new engagement from fans.
Remember, the only way to optimize social media performance with certainty is to test each assumption.
To further validate assumptions and analysis you can use a variety of other MavSocial reports. Here are a few examples:
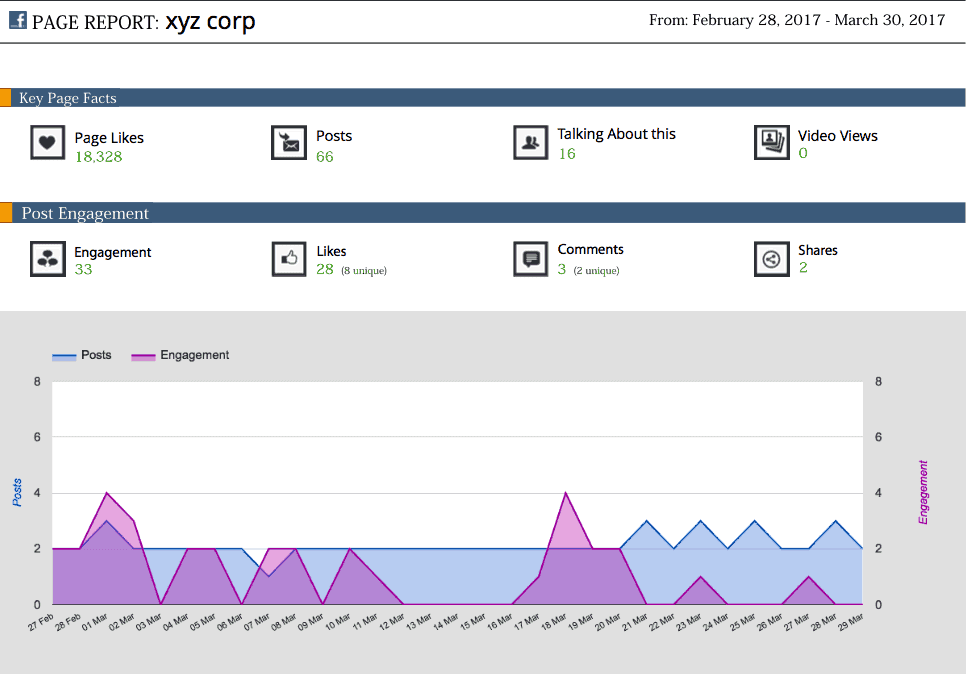
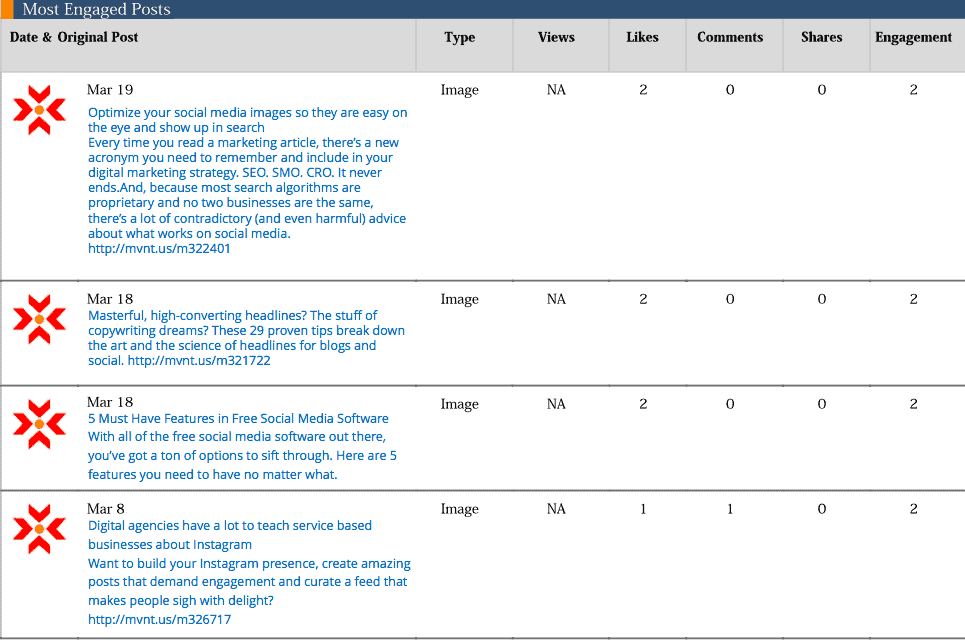
- Engagement Report – This report shows you engagement levels on each platform. The example below shows Facebook.

- Engagement Report By Time of Day – Analyze your data to determine what kind of posts get the most engagement, and whether this varies with different times of the day.
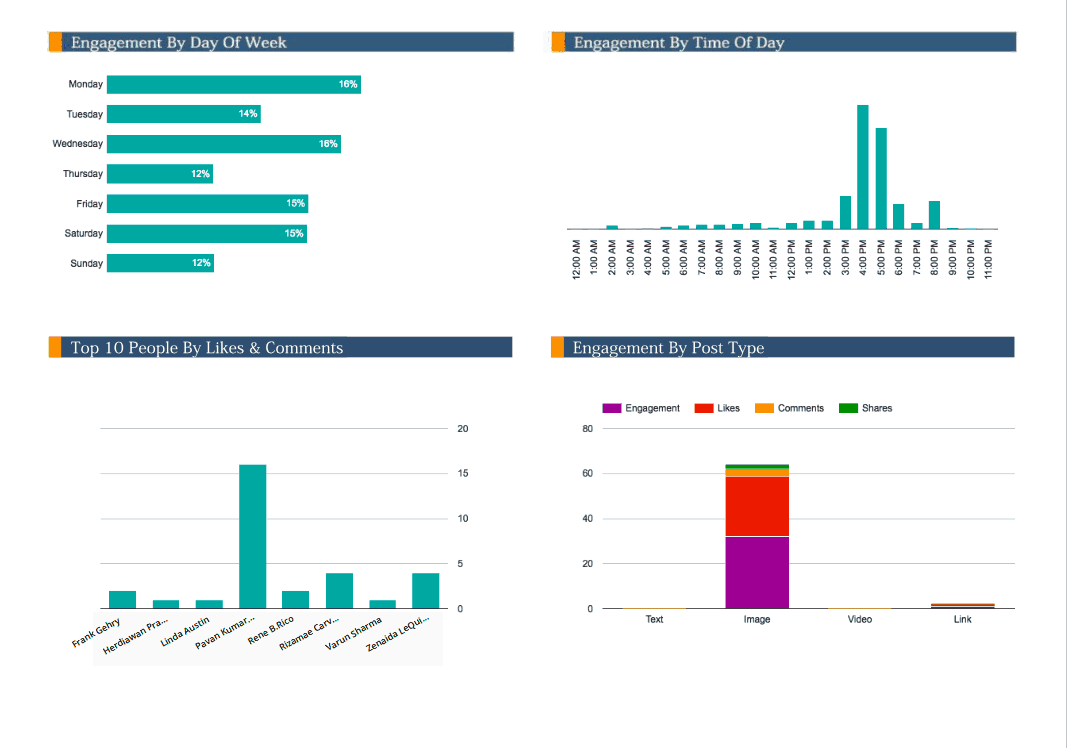
- Engagement by Post Type – This report shows you which type of post performs best with your audience on each network.
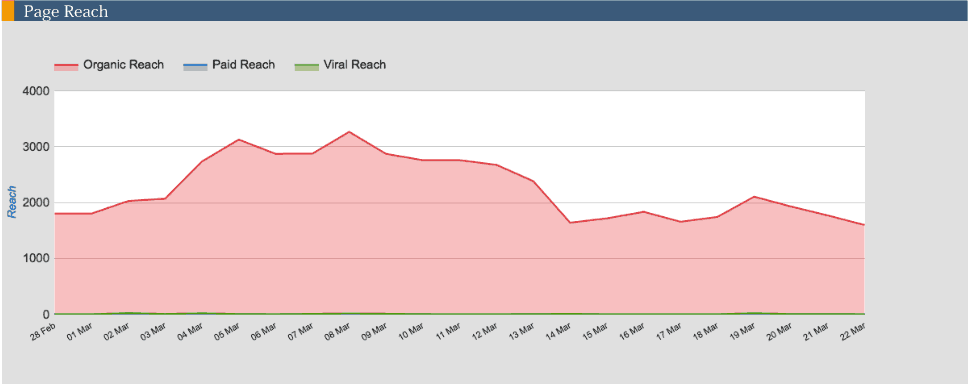
- Page Reach – Analyze organic, paid, and viral reach.
Want to measure the reach of your followers? MavSocial’s reporting features allow you to keep track of changes in follower growth enabling you to leverage peaks and investigate slumps.
Winning the Social Media Marketing Race with Flying Colors
MavSocial not only allows you to access analytics and develop targeted reports, but you can also create social media campaigns and schedule your social media content, all from logging into ONE easy-to-use platform.
Get your social media campaign on the right track by analyzing and enhancing your social media marketing performance. Create a social media marketing campaign that actually works by signing up for a free trial of MavSocial today.